Data! from a GPS!
For my final project in ICM, I wanted to process and display data on a GPS device I was creating for another class (prototyping electronic devices) with Aram. The device draws its location over time to an eink screen. The users location is traced like on an etchasketch, except it never resets, over time the user fills in more and more of the map as they experience the physical world around them. To me, the device speaks about movement and memory. I was so excited to get the perspective of my Professor Mimi because I had no idea how to approach the process of storing and retrieving the data.
The hardware stack I was looking to develop on was a set of adafruit components, I had an Adafruit M4, the adafruit Ultimate GPS Module, and a tricolor e ink screen breakout board also by adafruit. I really like them in New York because they ship so quickly. One of the perks of being in the city. This gave me a few preliminaries.
preliminaries.The tricolor screen being 200x200 meant that I would need to be filling an array just like in the first assignment about editing an image. I needed to use the Pixels array version with Arduino C. Turns out, with the Adafruit GFX_Library it looks like this:
void drawPixel(uint16_t x, uint16_t y, uint16_t color);
So, basically just like it is in P5.
I had one more thing, the NEMA GPS format. NEMA is the ASCII text line format that separates data fields with commas. My GPS module was sending data in this format using SPI and serial. Information I could get out of the $GPGGA string includes time, date, location, number of visible satellites, even altitude. Just parsing this one string gave me everything I needed to know. This website was an invaluable reference https://aprs.gids.nl/nmea/
Previously, I had used my Adafruit M4 Protoboard to pass through the NEMA strings to me via serial. From there it was a quick action to get it to log the data to an SD card verbosely. I used Adafruit's example sketches to work this code out.
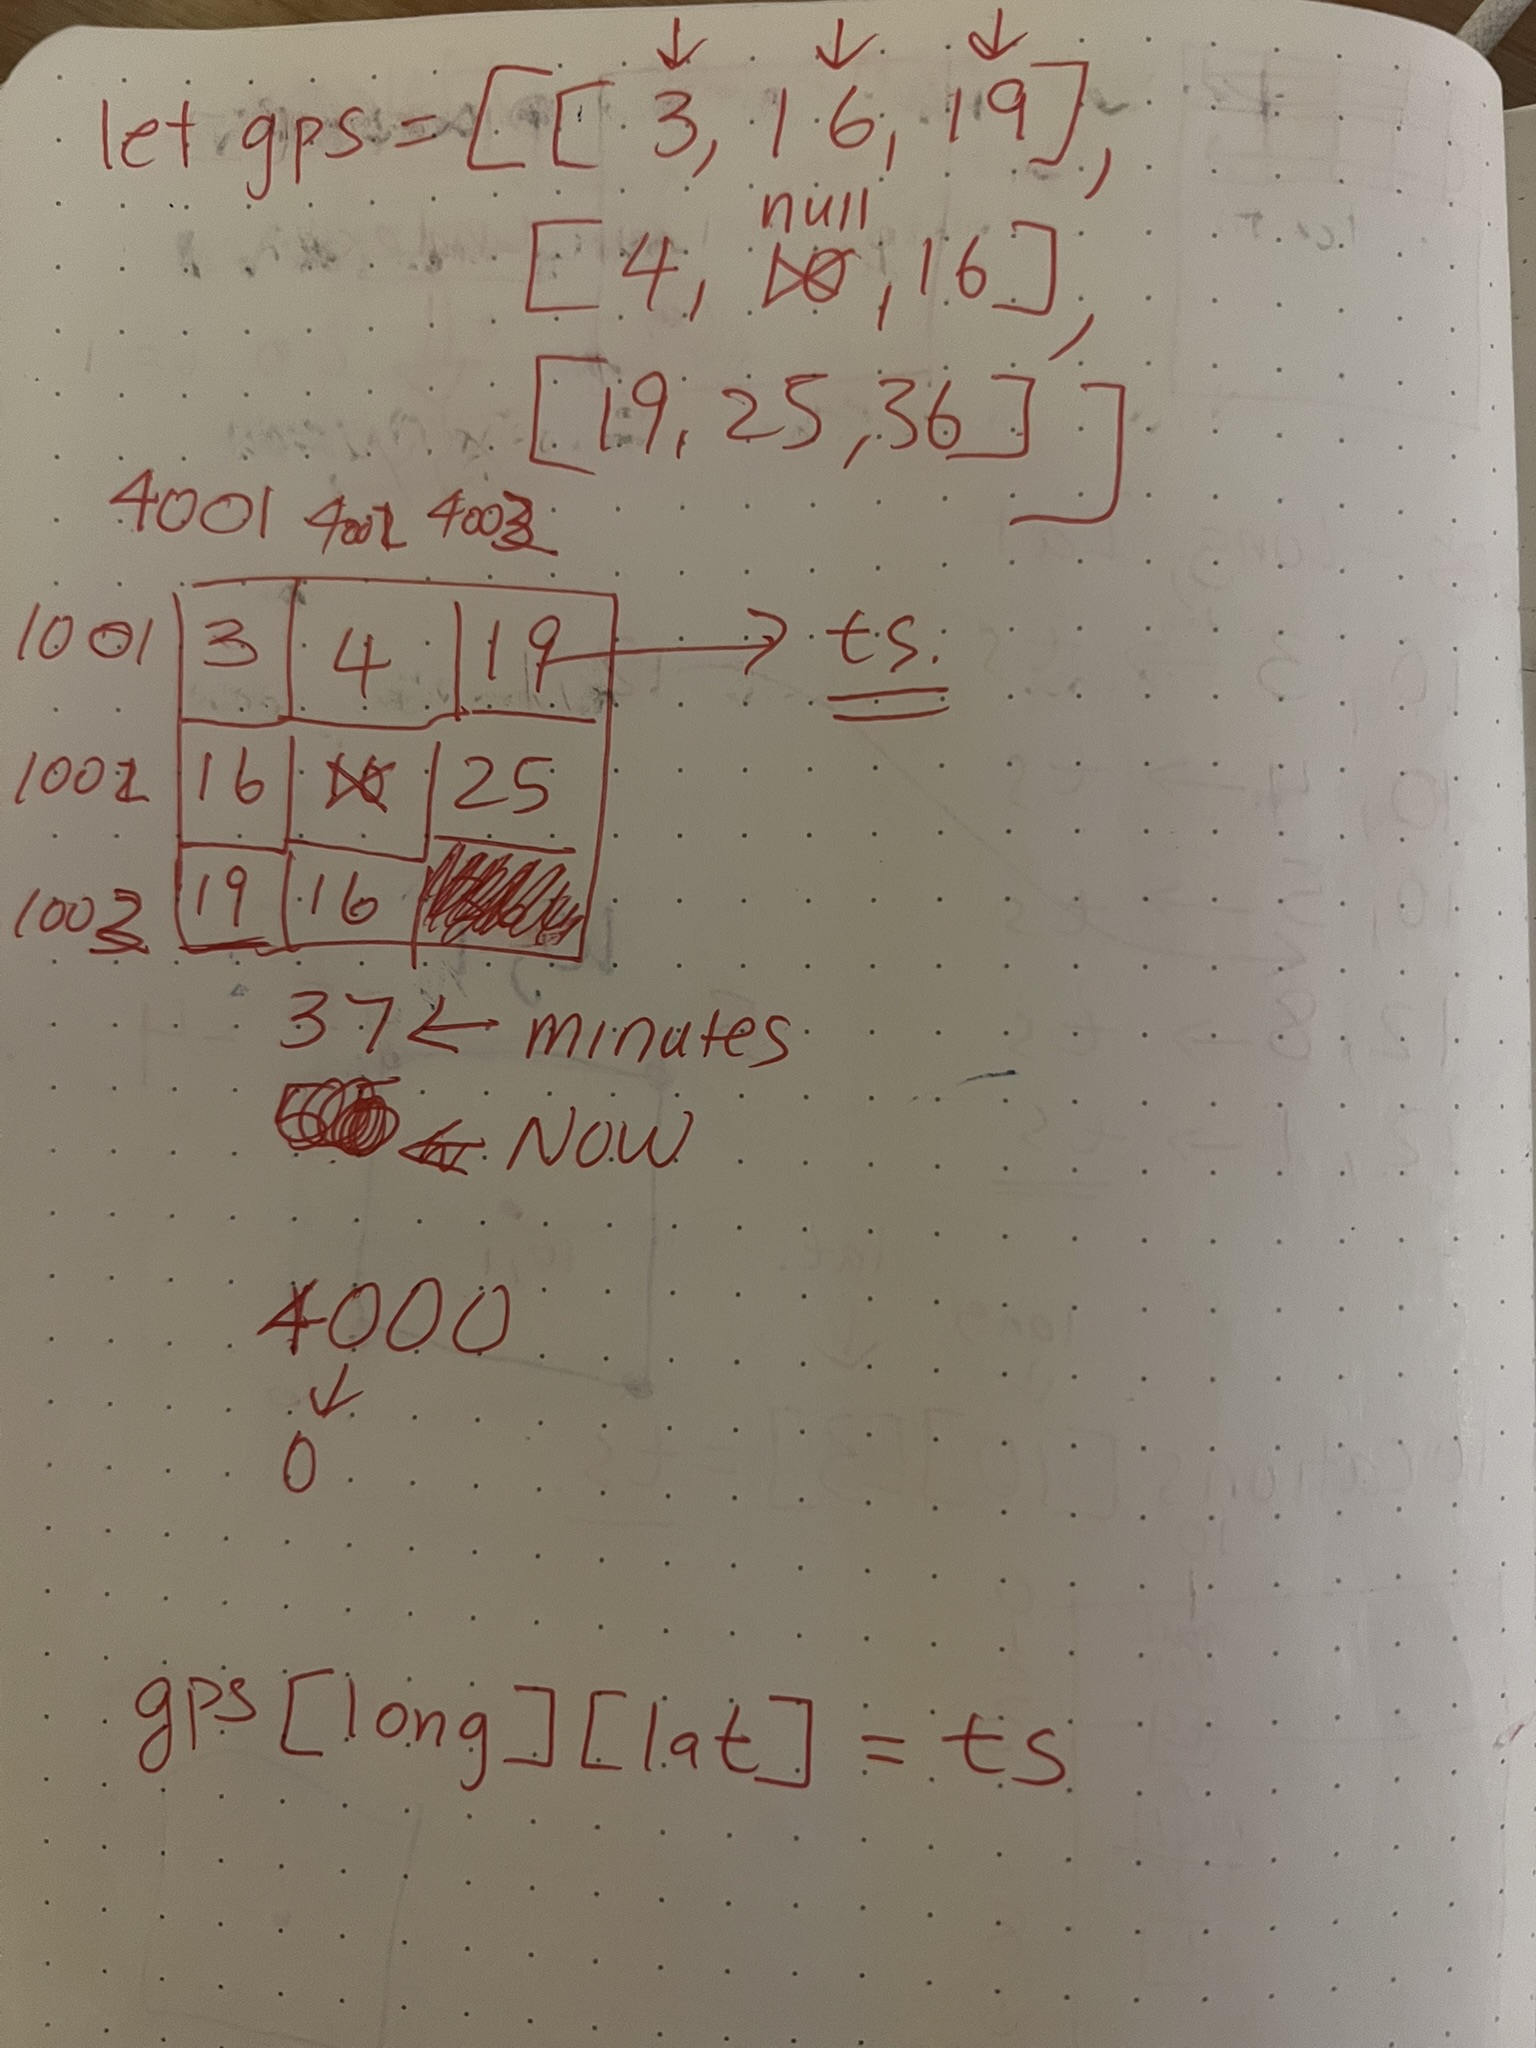
Discussing the project with Mimi helped me to understand how the architecture of the problem should be structured. On one side, the data from the NEMA sentence would have to be divided into a computer-readable format, she suggested lat+long+(seconds from 1970). Secondly, there would need to be some kind of loop which read the data and decided which pixels should be colored null, black, or red based on its time. The data would have to be a 2D array or a 1D array. I started too small with interpreting data, just 2D data 3x3.
SimpleRedDetect.js
let currentTime = 29304480;
let gps = [[3, 16, 19], [4, null, 20], [5, 18, 21]];
function setup() {
    createCanvas(200, 200);
    noStroke();

}

function draw() {
    background(255);
    for (let i = 0; i < gps.length; i++) {
        for (let j = 0; j < gps[i].length; j++) {
            if (gps[i][j] != null && gps[i][j] > 20) {
                fill(255, 0, 0);
                rect(i * width / gps.length, j * height / gps[i].length, 100);
            }
            else if (gps[i][j] != null) {
                fill(0, 0, 0);
                rect(i * width / gps.length, j * height / gps[i].length, width / gps.length);
            }
        }
    }
}
This was that sketch. Pretty Straightforward. Nested for loop to iterate through the 2d array which contained vaues between null and a time in seconds last visited. When I was going through this part of the semster I was so overwelmed with the work I was doing even starting on this process was a brain buster. Having a concrete first step to work through was so impactful. From here, it seemed to flow.
I needed to increase the size of the 2d array to 200x200 to match the size of the display. I also needed some way to fill the array with data. This was an excellent oprotunity to incorporate some of the mouse tracking stuff I had read about in Getting Started with P5.
fullSizeRedDetect.js
let gps = Array(200).fill(null).map(() => Array(200).fill(null));

function setup() {
    createCanvas(200, 200);
    noStroke();

}

function draw() {

    // Record mouse position and time to array
    if (mouseX > 0 && mouseX < width && mouseY > 0 && mouseY < height) {
        let i = mouseX;
        let j = mouseY;
        gps[i][j] = Date.now();
    }

    for (let i = 0; i < gps.length; i++) {
        for (let j = 0; j < gps[i].length; j++) {
            if (gps[i][j] != null && gps[i][j] > Date.now() - 3000) {
                fill(255, 0, 0);
                rect(i, j, 1);
            }
            else if (gps[i][j] != null) {
                fill(0, 0, 0);
                rect(i, j, 1);
            }
        }
    }
}
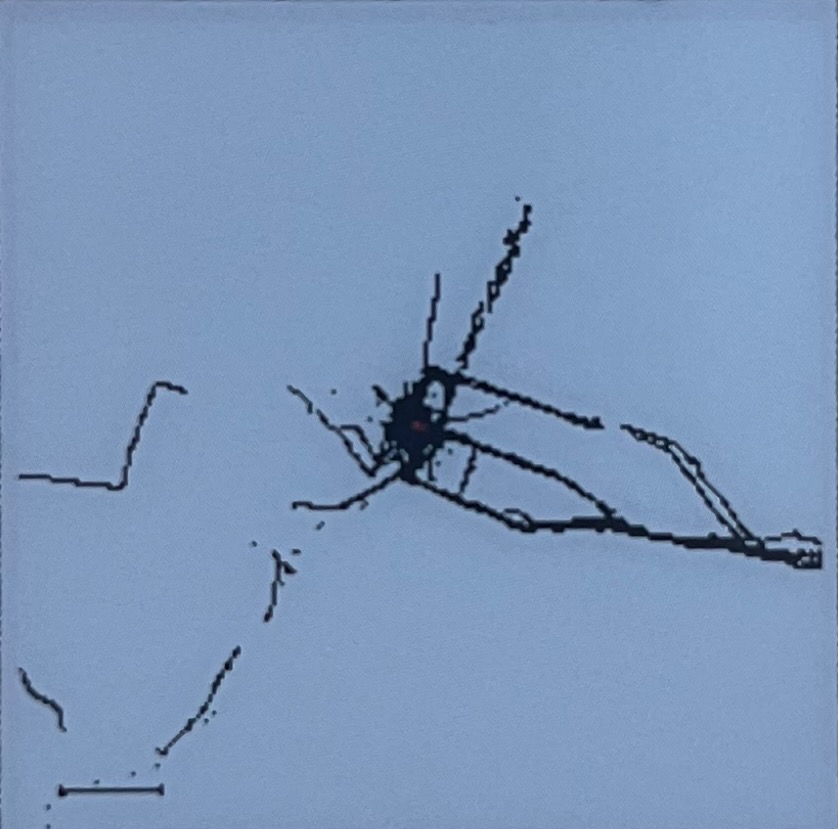
This part felt so awesome. Claude introduced me to a new way to create 2d arrays in javascript and the mouse movement integration was so easy. I was getting the first visual of what my physical device would look like. It was also my first time making an interactive code painting drawing thingy which I am very proud of. I like the timing of the effect and the way the mouse movement when too quick makes pixels skip and not illustrate. This mirrors how the gps later ended up recording the data with thicker lines occuring in places it lingered most.
As I moved into working with the eink display (they are so hard to get running). Pushing code to it felt suprisingly natural. I was starting to embrace P5 as a way to generate ideas for other work. This sketch I used a very simular draw rectangle command inside of the ADAFRUIT_GFX library.
drawSingleImageArray.js
void loop() {
Serial.println("DrawImageDemo");
display.clearBuffer();

for(int i = 0; i < 200; i++) {
    for(int j = 0; j < 200; j++) {
    if(((i / scale) + (j / scale)) % 3 == 0) {
        display.drawPixel(i, j, EPD_BLACK);
    }
    else if(((i / scale) + (j / scale)) % 3 == 1) {
        display.drawPixel(i, j, EPD_RED);
    }
    else {
        display.drawPixel(i, j, EPD_WHITE);
    }
    }
}

display.display();
delay(180000);
}
Plenty of claude went into this integration of the data and the eink screen. I had a good foundation going in. The sketch which I had previously modified to write the nema sentences to the sd card was a great foundation. All I needed to do was chop the code down, create the array, loop through my data, and write to it.
Unfortunatly I learned pretty quick that using a 2d array to represent a gps range even as new york city was impractical given the size of my computer. 1D array it was. Claude introduced me to using a .bit file along side the verpose .txt file of decoded nema statements I had saved previously.
It was enlightening how fast I was able to move through the deveopment process for the gps with claude. I asked a Nico who was on the floor at the time and a major claude code user what he does when the gpt does the problem too well and sweeps off past your understanding. He said at a certain point, you have to trust it and move into the level of archetectre. Using git as a lifeline. As I have progressed with this project since, this has been my strategy.
One thing the ai failed to notice (and me too, untill I took the gps back home for vacation and it drew my hometown backwards) is that the gps data is mapped flipped! Because the nema format reports the numbers as negetives and my gpt code has concotinated the - sign, eveything was drawing in the reverse order it has been recorded.
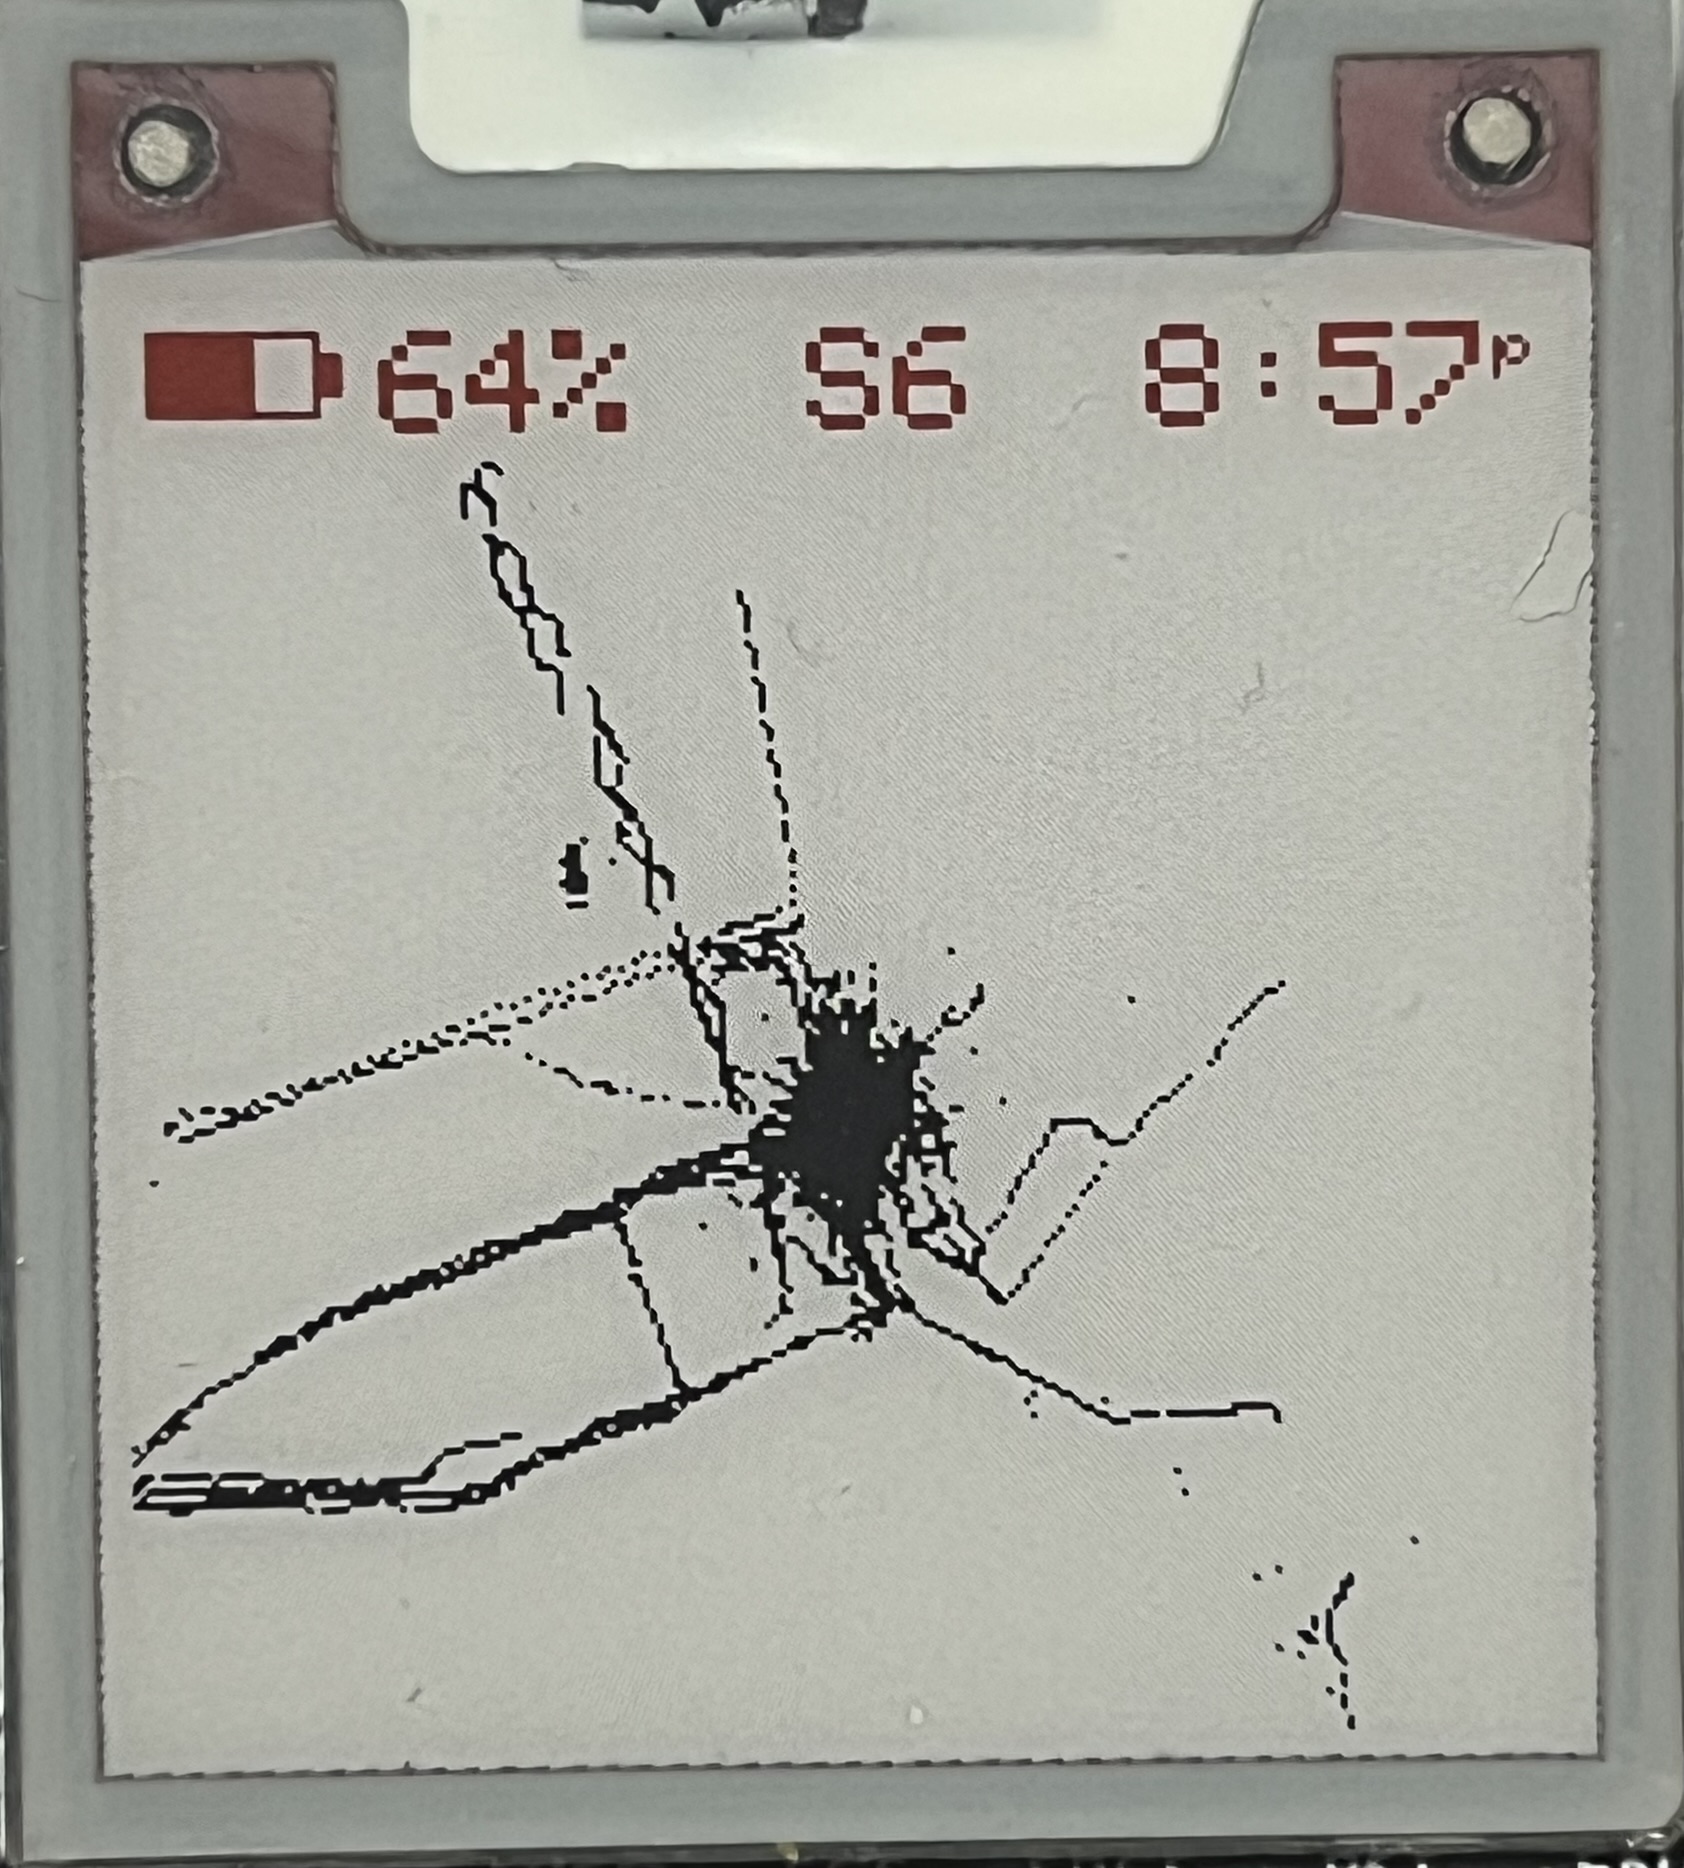
After sleeping a couple times and taking a lap this was the resting place of where I was able to take it.I am very pleased with this iteration of the code. There is still a lot of work to do, but thats life.